

Use the overview, realtime view, and operator table to decide what your support team should change next.
Analytics is most useful when you connect a number with the conversations behind it. Start with the 30-day overview, then narrow the question before exporting anything.
Open Analytics from the dashboard or from the help link in the top bar. The cards show conversation volume, active conversations, response time, and CSAT. The charts below add trends and operator context.
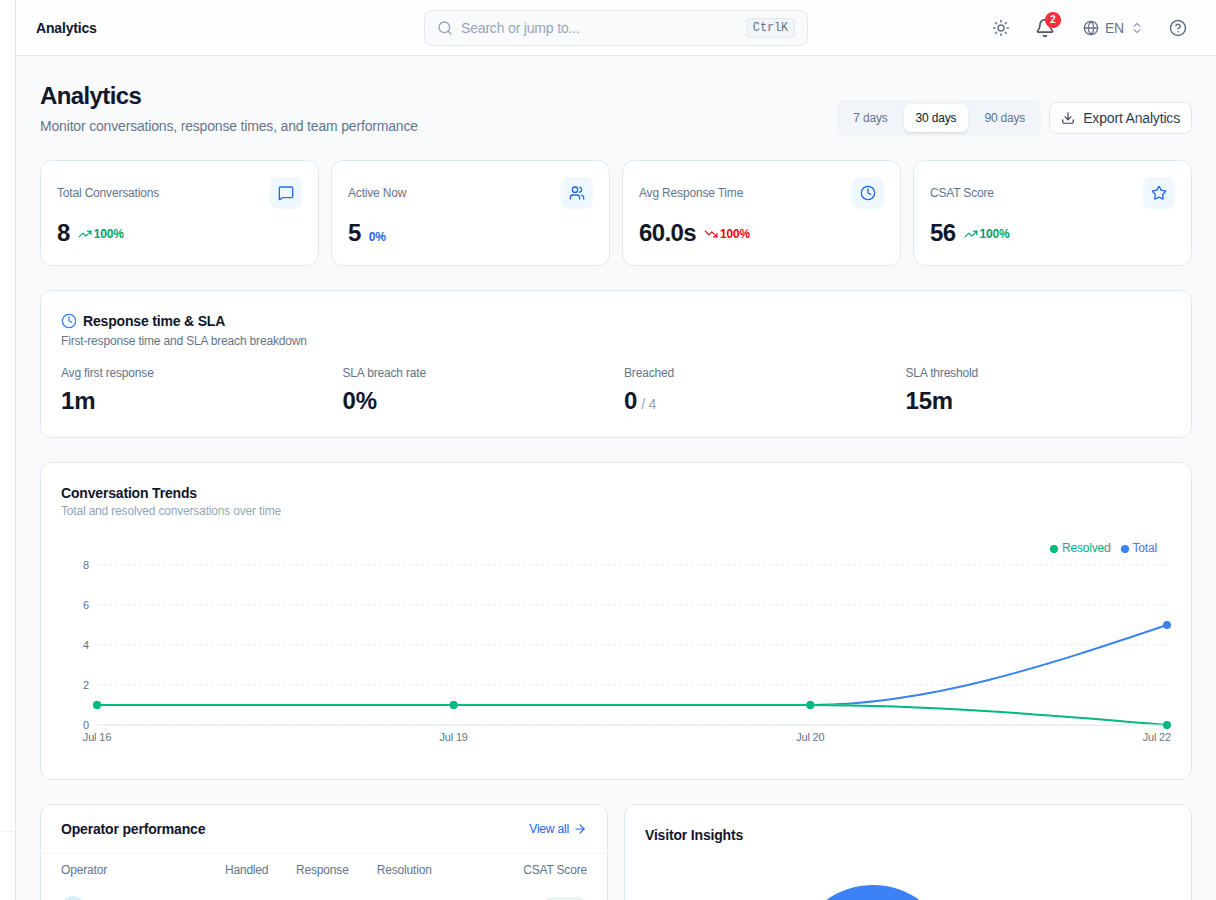
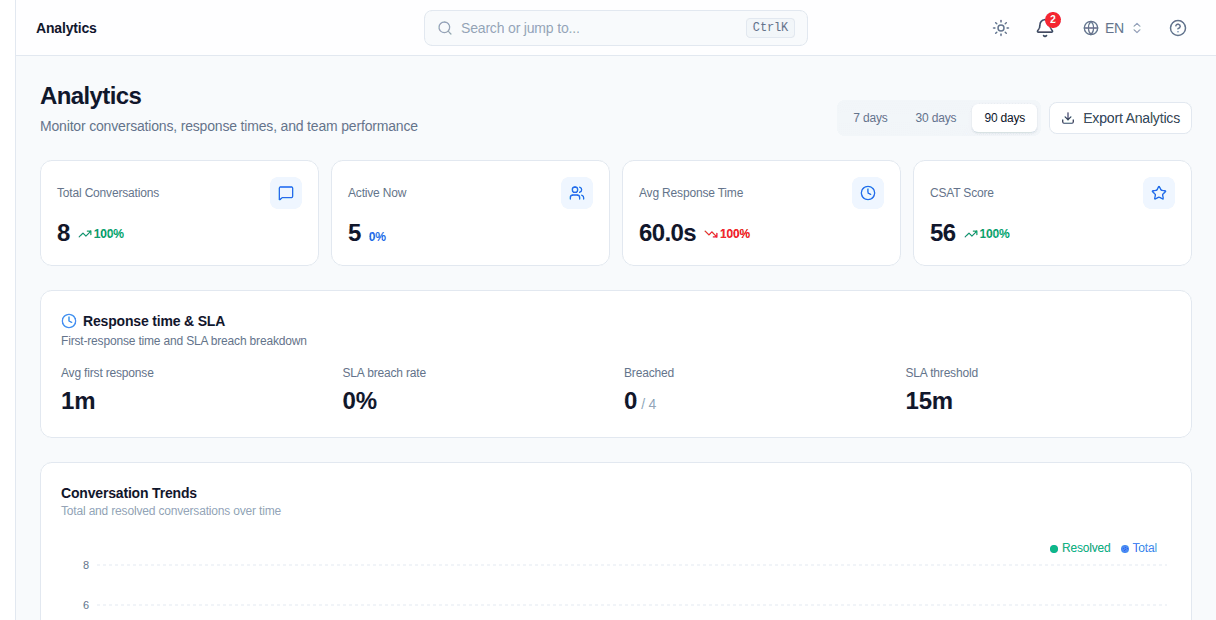
Use the range selector when a single week is too noisy. The 90-day view gives you a steadier baseline for staffing and seasonal changes.
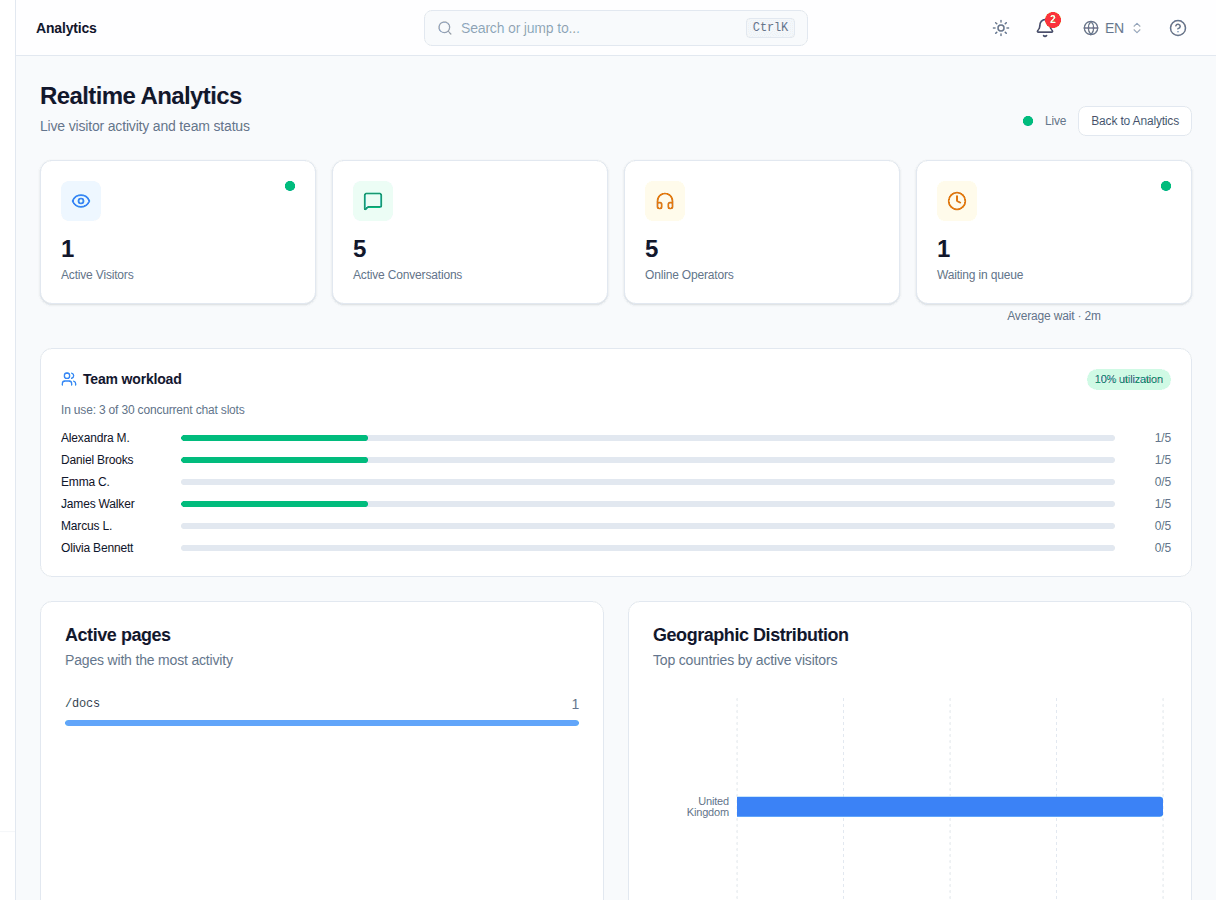
Open Realtime Analytics when the queue feels different from the weekly report. Active visitors, open conversations, queue depth, and team workload update together, so you can tell whether a slow response comes from staffing or a sudden spike in demand.
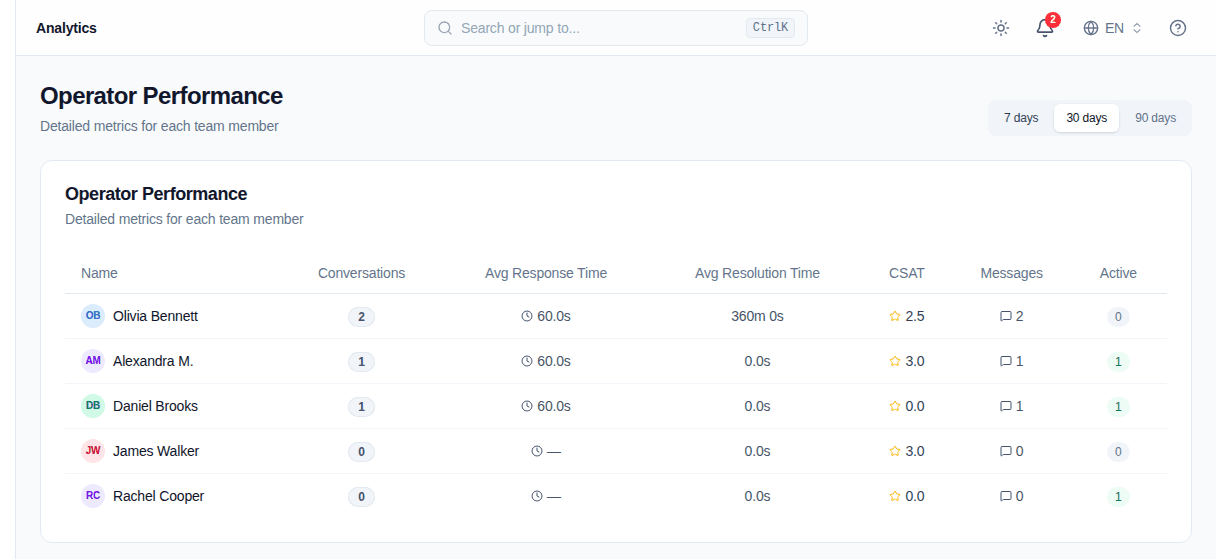
The Operator Performance table breaks down handled conversations, response time, and satisfaction for each person. Use it for coaching and shift planning. Avoid ranking people on the basis of one busy afternoon; compare the same date range for everyone.
Review the 30-day overview once a week. Check the realtime view during handovers, and use the operator view in one-to-one conversations. Export only the range you need to share.
Last updated: Jul 23, 2026
Was this page helpful?